Australia’s homelessness has been rising since 2012. To better understand the cause, we examined the relationship between homelessness, population growth, and housing availability. Based on data from the Australian Bureau of Statistics (ABS), one possible reason may be the lasting effects of the Global Financial Crisis (GFC).
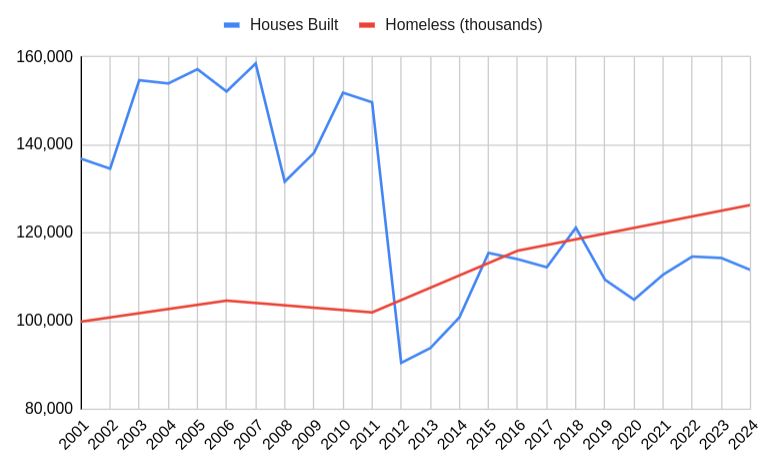
ABS figures show a sharp decline in the number of new homes built in 2012, which may have contributed to the ongoing housing shortage.
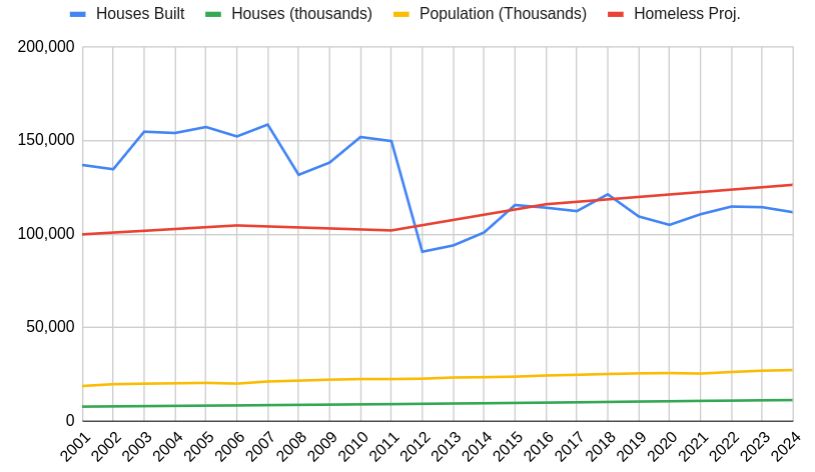
The graph illustrates that between 2001 and 2024, both Australia’s population (yellow line) and total housing stock (green line) have grown steadily. However, the number of new homes built each year (blue line) dropped sharply around 2012 and has not returned to previous levels. During this same period, homelessness (red line) has continued to rise.
Notably, the sharp decline in new housing construction around 2012 aligns with the point at which homelessness in Australia began increasing by the thousands, rather than decreasing.
Australia saw strong home construction throughout the 2000s, but a sharp decline in 2012 led to a long-term gap in housing supply (blue line). Since that point, homelessness has continued to rise (red line).
While the exact cause is not certain, there is reason to believe the GFC may have played a role. During the GFC, the Australian Government introduced stimulus measures that helped shield the economy. However, when these supports ended in 2012, confidence in the housing market dropped. As a result, fewer new homes were built, contributing to ongoing supply challenges.
Although Australia had the financial capacity to purchase building materials after the GFC, global supply shortages, particularly as the United States continued its recovery, made it difficult to source the materials needed for new housing construction.
Additional factors also contributed to the slowdown, including community resistance to new developments. The “Not In My Back Yard” (NIMBY) movement, driven largely by the baby boomer generation, saw growing opposition to large-scale housing projects across many areas.
To support this article, data was sourced from the Australian Bureau of Statistics (ABS) and compiled into a custom dataset to help identify key trends and patterns.
Further Resources:
GRAPHS
DATA TABLE
| YEAR | Houses Built | Houses Built Change | Houses Available Census | Houses Av. Cen+Proj | Houses (thousands) | House (th) Change | Population | Population (Thousands) | Population (th) Change | Homeless | Homeless Proj. | Homeless Change |
| 2001 | 136,907 | 0.00% | 7,790,079 | 7,790,079 | 7,790 | 0.00% | 18,769,249 | 18,769 | 0.00% | 99,900 | 99,900 | 0.00% |
| 2002 | 134637 | -1.66% | 7,917,375 | 7,917 | 1.61% | 19,757,900 | 19,758 | 5.00% | 100,855 | 0.95% | ||
| 2003 | 154720 | 14.92% | 8,044,671 | 8,045 | 1.58% | 20,008,700 | 20,009 | 1.25% | 101,810 | 0.94% | ||
| 2004 | 154000 | -0.47% | 8,171,967 | 8,172 | 1.56% | 20,229,800 | 20,230 | 1.09% | 102,766 | 0.93% | ||
| 2005 | 157227 | 2.10% | 8,299,263 | 8,299 | 1.53% | 20,452,300 | 20,452 | 1.09% | 103,721 | 0.92% | ||
| 2006 | 152177 | -3.21% | 8,426,559 | 8,426,559 | 8,427 | 1.51% | 20,061,646 | 20,062 | -1.95% | 104676 | 104,676 | 0.91% |
| 2007 | 158536 | 4.18% | 8,564,654 | 8,565 | 1.61% | 21,181,000 | 21,181 | 5.28% | 104140.8 | -0.51% | ||
| 2008 | 131681 | -16.94% | 8,702,749 | 8,703 | 1.59% | 21,644,000 | 21,644 | 2.14% | 103,606 | -0.52% | ||
| 2009 | 138211 | 4.96% | 8,840,843 | 8,841 | 1.56% | 22,155,000 | 22,155 | 2.31% | 103070.4 | -0.52% | ||
| 2010 | 151892 | 9.90% | 8,978,938 | 8,979 | 1.54% | 22,477,400 | 22,477 | 1.43% | 102,535 | -0.52% | ||
| 2011 | 149709 | -1.44% | 9,117,033 | 9,117,033 | 9,117 | 1.51% | 22,485,300 | 22,485 | 0.04% | 102,000 | 102000 | -0.52% |
| 2012 | 90,540 | -39.52% | 9,273,926 | 9,274 | 1.69% | 22,683,600 | 22,684 | 0.87% | 104,800 | 2.67% | ||
| 2013 | 93912 | 3.72% | 9,430,818 | 9,431 | 1.66% | 23,319,400 | 23,319 | 2.73% | 107600 | 2.60% | ||
| 2014 | 100881 | 7.42% | 9,587,711 | 9,588 | 1.64% | 23,490,700 | 23,491 | 0.73% | 110,400 | 2.54% | ||
| 2015 | 115519 | 14.51% | 9,744,603 | 9,745 | 1.61% | 23,781,200 | 23,781 | 1.22% | 113200 | 2.47% | ||
| 2016 | 114089 | -1.24% | 9,901,496 | 9,901,496 | 9,901 | 1.58% | 24,385,600 | 24,386 | 2.48% | 116,000 | 116,000 | 2.41% |
| 2017 | 112259 | -1.60% | 10,091,638 | 10,092 | 1.88% | 24,770,700 | 24,771 | 1.55% | 117,299 | 1.11% | ||
| 2018 | 121241 | 8.00% | 10,281,781 | 10,282 | 1.85% | 25,180,200 | 25,180 | 1.63% | 118,598 | 1.10% | ||
| 2019 | 109426 | -9.75% | 10,471,923 | 10,472 | 1.82% | 25,522,169 | 25,522 | 1.34% | 119,896 | 1.08% | ||
| 2020 | 104897 | -4.14% | 10,662,066 | 10,662 | 1.78% | 25,687,041 | 25,687 | 0.64% | 121,195 | 1.07% | ||
| 2021 | 110600 | 5.44% | 10,852,208 | 10,852,208 | 10,852 | 1.75% | 25,422,788 | 25,423 | -1.04% | 122,494 | 122,494 | 1.06% |
| 2022 | 114688 | 3.70% | 10,999,572 | 11,000 | 1.34% | 26,268,359 | 26,268 | 3.22% | 123,793 | 1.05% | ||
| 2023 | 114367 | -0.28% | 11,146,936 | 11,147 | 1.32% | 26,966,789 | 26,967 | 2.59% | 125,092 | 1.04% | ||
| 2024 | 111652 | -2.37% | 11,294,300 | 11,294,300 | 11,294 | 1.30% | 27,309,396 | 27,309 | 1.25% | 126,390 | 1.03% |
To view the spreadsheet, you may do so here
HOMELESS STATISTICS
2001:https://www.abs.gov.au/Ausstats/[email protected]/0/ae341f393a629479ca256de10080577d?OpenDocument
2006:https://www.aihw.gov.au/reports/housing-assistance/counting-homeless-2006-nsw/contents/summary
2011:https://www.aihw.gov.au/reports/australias-welfare/homelessness-and-homelessness-services
2016:https://www.aihw.gov.au/reports/australias-welfare/homelessness-and-homelessness-services
2021:https://www.aihw.gov.au/reports/australias-welfare/homelessness-and-homelessness-services
POPULATION STATISTICS
To find relevant statistics click on December (Year) – For example December 2019 – then click on ‘Australian Demographic Statistics’
2020:https://www.abs.gov.au/statistics/people/population/national-state-and-territory-population/jun-2020
2021:https://www.abs.gov.au/statistics/people/population/population-census/latest-release
2022:https://www.abs.gov.au/statistics/people/population/national-state-and-territory-population/dec-2022
2023:https://www.abs.gov.au/statistics/people/population/national-state-and-territory-population/dec-2023
2024:https://www.abs.gov.au/statistics/people/population/national-state-and-territory-population/sep-2024
HOUSES BUILT STATISTICS
2001-2024:https://www.abs.gov.au/statistics/industry/building-and-construction/building-activity-australia
HOUSES AVAILABLE STATISTICS
2001:https://abs.gov.au/census/find-census-data/quickstats/2001/0
2006:https://abs.gov.au/census/find-census-data/quickstats/2006/0
2011:https://abs.gov.au/census/find-census-data/quickstats/2011/0
2016:https://abs.gov.au/census/find-census-data/quickstats/2016/0
2021:https://abs.gov.au/census/find-census-data/quickstats/2021/AUS